
When I had a need to visualise telemetry data from a home project, the ELK stack was my go-to solution. The ELK stack (Elasticsearch, Logstash, Kibana) is an open-source-ish[i] tool for ingesting, searching, and visualising data.
(scroll up for top of post)
What is the ELK stack? There are three main components:
- Elasticsearch is a text search engine, based on Apache Lucene. It uses clever tricks like inverted indexes and parallel searching over multiple shards to provide fast results. Data is stored as schema-free JSON documents, grouped by index.
- Logstash is an engine that can ingest data from multiple sources into pipelines that structure, enrich and transform it, then store the results into Elasticsearch and/or send it to other destinations.
- Kibana is a web interface for viewing and visualising the data stored in Elasticsearch.
Note that the ELK Stack is also known as the “Elastic Stack”[ii].
The first challenge was working out how to run ELK on some seriously old hardware. There are a minimum of 3 servers required to run ELK (one server for each letter of the acronym). On a single slow old PC, virtual machines were not an option, as they would use more resources than were available.
Containers to the rescue – they are an efficient way to spin up multiple workloads on a single host operating system. Here is a high-level view of what we’re building:

Figure 1 – Overview of what we’re building
Step 1 – Prepare Host Machine to run Containers
I started with an old Linux (Ubuntu) PC with 2GB of RAM – consider this a bare minimum. 4GB of RAM will work better. Alternatively, you can spin up a virtual machine (VM).
The instructions below are for Ubuntu but should translate easily to other types of Linux.
Start by making sure Linux is up to date (Ubuntu 20.04 used here, but should be similar in newer versions)
sudo apt-get update
sudo apt-get upgrade
Install git and Docker:
# Install git for source-code management and to clone repo:
sudo apt-get install git

# Install Docker to run containers:
sudo apt install docker.io
sudo systemctl enable --now docker

# Test:
sudo docker run hello-world
This should return a screen of text including the lines:
…
Hello from Docker!
This message shows that your installation appears to be working correctly.
…
Install the docker compose plug-in:
sudo apt-get install docker-compose-pluginCheck the installed docker compose plug-in version:
docker compose versionStep 2 – Clone the ELK Docker Repo
I found a good repo (https://github.com/deviantony/docker-elk) on GitHub with the basic scaffolding and instructions for standing up a simple stack of ELK containers. While this isn’t a production-ready ELK install (as it clearly states), it is certainly good enough to learn the technology and have a play, and it provides a good base to build from.
First, we clone the repo:
cd
git clone https://github.com/deviantony/docker-elk.git
cd docker-elk
Update passwords from ‘changeme‘ for Elastic, Logstash and Kibana to something stronger by editing the .env file. We use vi as the editor, but you can use others such as vim, nano etc.
vi ~/docker-elk/.envCreate strong passwords where underlined in orange:
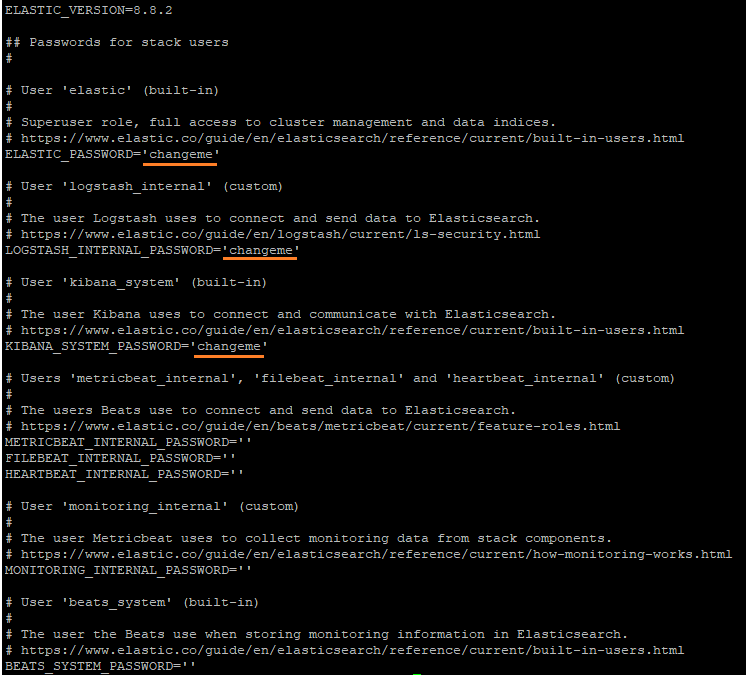
Take a note of the Elastic password as you set as you’ll need it later to log into Kibana.
Step 3 – Configure Logstash
For my use case I wanted to be able to ingest syslog messages. To do this, we add the syslog plug-in to Logstash to make it easy to ingest syslog messages. Edit the Logstash Dockerfile:
vi ~/docker-elk/logstash/DockerfileAdd this line to the end of the file to load the syslog plug-in when the container is built:
RUN logstash-plugin install logstash-input-syslogNext, we want to add a container port mapping to allow the syslog traffic in to Logstash. Edit docker-compose:
vi ~/docker-elk/docker-compose.ymlAdd this line to the Logstash ports section:
- 55514:55515/udpAdd this to the end of the Logstash section to avoid having to restart container when updating the config:
command: --config.reload.automaticIt should now look like this:
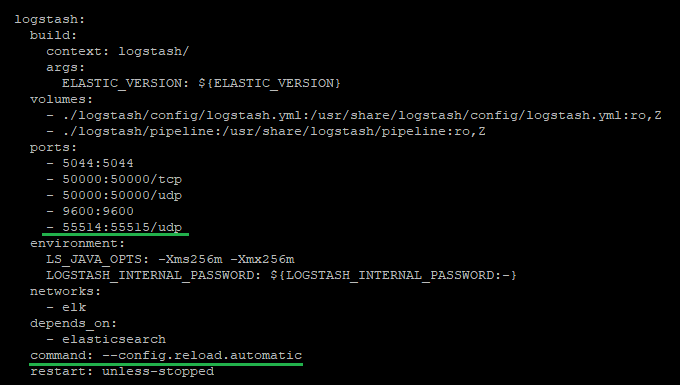
This tells Docker to map outside port UDP-55514 to port UDP-55515 on the Logstash container. We use a high number port greater than 1024 to avoid need for root privileges. You can use different port numbers if you prefer, but make sure they are not in use and match the definitions later.
Now we need to edit the Logstash pipeline to ingest data. Edit this file:
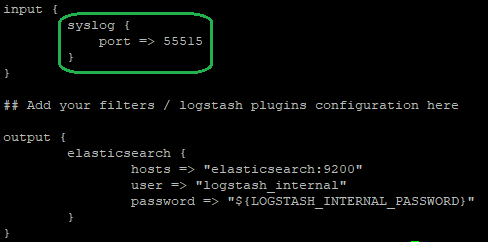
vi ~/docker-elk/logstash/pipeline/logstash.confAdd this to the input section to tell Logstash to receive syslog messages on UDP port:
        syslog {
            port => 55515
        }
Delete the beats and tcp stanzas as we’re not using them for this use case.
The input section should now look like this:
Step 4 – Configure Elasticsearch
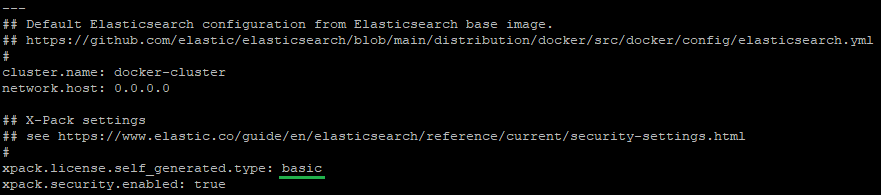
We disable the 30-day free trial of paid-for Elastic features (you can leave it on if you want):
Edit this file and change xpack.license.self_generated.type from ‘trial’ to ‘basic’:
vi ~/docker-elk/elasticsearch/config/elasticsearch.ymlIt should look like this:
Step 5 – Container Setup
Start ELK containers,and run setup first time:
cd ~/docker-elk/
sudo docker compose up setup
Containers will be downloaded, and setup routines run. It should exit with code 0.
Run the containers for real this time, in non-daemon mode so we can see the output as we want to check things are running properly.
sudo docker compose upNow’s a good time to go make a coffee, as the bring up of the containers will take a while (allow at least 5 minutes, maybe longer). It will pop a lot of errors along the way – be patient.
Step 6 – Log in to Kibana
In a web browser, connect to the ELK PC on TCP port 5601. If you’re doing it on the same PC, the URL would be:
From a different location substitute the IP address of the PC for localhost, example for IP 192.168.1.20:
If the connection doesn’t work, check that you have IP connectivity to the ELK PC with PING and check if there is a firewall running.
In the browser, log in as username elastic and use the password for Elastic that you set in the .env file previously.
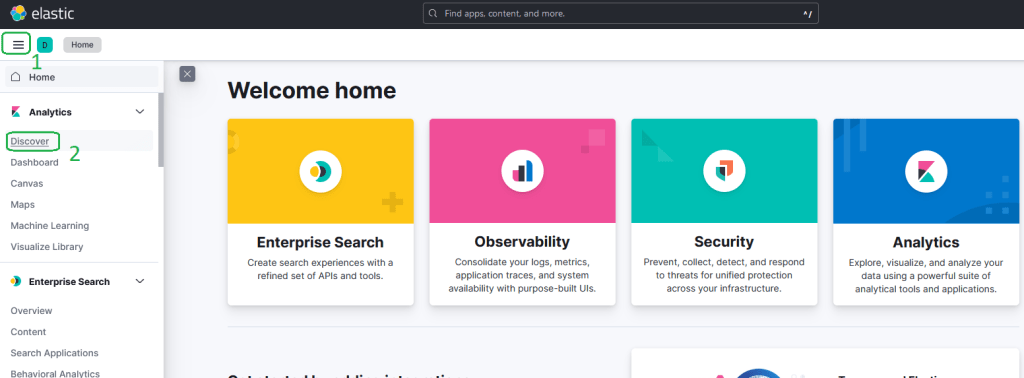
In the web browser, click on the hamburger icon top left, then on Discover in the menu:
Step 7 – Send a Test Log Message
Let’s send a test syslog message into the stack. Run this command on the ELK PC in another terminal window:
logger -n localhost -P 55514 -p user.notice "Hello World!"In Kibana Discover screen, click refresh and you should see the log message appear.
Congratulations, you just built an ELK stack 😊
[i] Elasticsearch and Kibana are not fully open source by some definitions, see https://www.elastic.co/pricing/faq/licensing#elasticsearch-kibana-open-source for more information. See https://opensearch.org/about.html if you need a full-FOSS Apache 2 licensed alternative.
[ii] The marketing department of Elasticsearch B. V. are attempting to rebrand ELK as Elastic Stack to remove the constrictions of the acronym, thus allowing them to add more products, see https://www.elastic.co/what-is/elk-stack

2 thoughts on “Build an ELK Stack”