
Is a picture really worth a thousand words? What if that picture was a diagram?
A colleague recently introduced me to Diagrams as Code, using PlantUML, and in this post we explore the concept of diagrams-as-code, and how to use PlantUML.
Diagram Methods
Let’s start with some background. Diagrams should engage their audience, informing them and encouraging collaboration. Understanding the knowledge and needs of your audience is critical to creating a successful diagram.
We adjust the diagram to suit the audience, using different views of people / process / technology to inform and engage them. Often, we will draw multiple views of the same system to suit the needs of different audiences, as per Figure 1.

Figure 1 – Example of Multiple Views of the Same System to Suit Different Audiences
Sometimes we may be the audience – I often find myself drawing diagrams to remind future me of how a solution is architected.
The Human and the Diagram
Diagrams are similar to geographical maps, and the link to physical navigation has a basis in cognitive neuroscience[1] – we use the same parts of the brain when viewing a diagram as we do when we use a map to find our way around a foreign city.
Maps are easier to read when we understand the symbols (conventions), and especially when they describe an area we have been before (familiarity). What we can learn from this is a good diagram should be designed to have low cognitive effort for the viewer to comprehend, and thus we often stick to conventions to ease the mental load on the audience.
Diagrams in My World
As a solution architect, I use diagrams to communicate and collaborate on concepts with different audiences. My go-to diagram methods are the whiteboard (physical or virtual) and Microsoft Visio.
Whiteboards are great when you need to draw something quickly, and they encourage collaboration[2], but a downside is they are not very structured. Hand writing can be hard to read, and the results are not easy to share and build upon at a later date.
Visio, PowerPoint and their ilk are powerful visualisation tools, however they generate binary files that can be large and there is little consistency between diagrams. They also require training to master.
I am interested in diagrams-as-code to see if they can be a useful addition to my diagramming repertoire, and thus help me be more effective in my job.
What are Diagrams as Code?
Diagrams as Code is the generation of visualisations from code source files (abstract instructions) that say how to build the diagrams. We see this in Figure 2, where a creator writes the diagram code and the diagramming tool renders this to an image file that they and the audience can view.

Figure 2 – Diagrams as Code Concept
Why use Diagrams as Code?
Reasons to consider using diagrams-as-code include:
Concentrate on the Concepts
Expressing the diagram-as-code shifts the focus from diagram mechanics (i.e. how to make more room on the page, etc.) to key concepts such as listing the components then how they relate. This may make it easier to describe a system, allowing a text-based description first then tune the visualisation afterwards. It also decouples the content from the visualisation styles.
Source Control
Traditional diagram tools use binary files that are opaque to changes between versions. Diagram as code source is text, allowing diffs between versions, and also use of check-in comments on commits. Perhaps even more importantly, diagrams can be included with versions of the code so that they stay in-sync with what they are documenting.
Code Forward-Engineering
Forward-engineering is a software engineering paradigm that starts with modelling the concept in a diagram-as-code language that is then used to programmatically generate skeleton code, as per Figure 3.
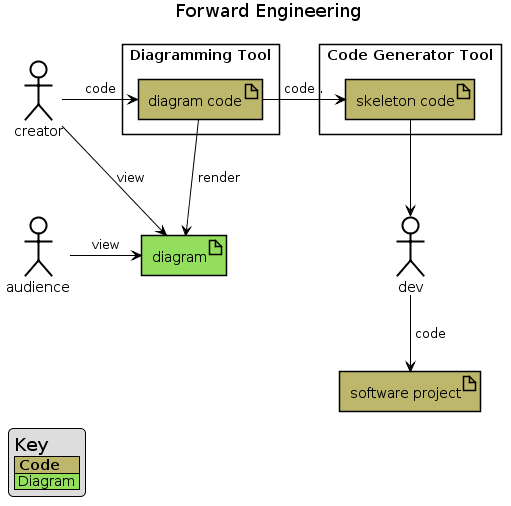
Figure 3 – Forward-Engineering with Diagram as Code
Forward-engineering can have benefits in terms of collaboration and design focus and may be used on specific areas of code (sketches)[3]
Code Reverse-Engineering
Reverse-engineering generates diagrams from existing code, as per Figure 4.
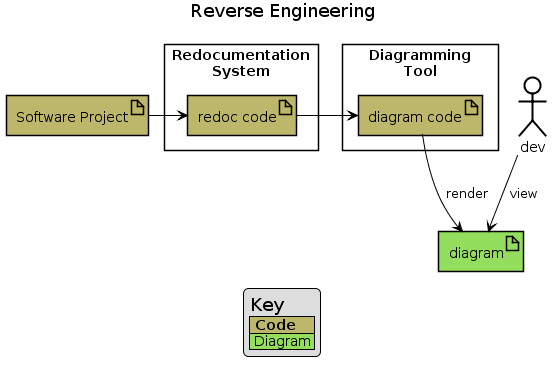
Figure 4 – Reverse-Engineering Code to Diagrams as Code
Reverse-engineering helps devs to better understand how code is constructed, especially in cases where they have inherited code that is not well documented.
Infrastructure as Code also presents an opportunity for reverse-engineering as we can programmatically generate diagrams based on actual deployed state of the infrastructure – no more out-of-date support diagrams! 🙂
Another opportunity comes from generating diagrams from code specification files, such as API specifications.
Less mouse time
Diagrams-as-code eliminates diagram drag-and-drop UI mouse time. This can be an advantage for people with occupational overuse syndrome or accessibility challenges.
Smaller File Size
Visio diagrams, PowerPoints etc. can easily run to megabytes, whereas code-based diagrams are likely to be orders of magnitude smaller.
What is PlantUML?
PlantUML an open source diagrams-as-code project that uses its own domain-specific language (DSL)[4], based on UML (Unified Modelling Language), to render diagrams from code.
PlantUML can be used in many ways; it has plug-ins for many IDEs, wikis and repos. Check out http://plantuml.com/running for more info.
I use PlantUML plug-in with the Visual Studio Code IDE. One drawback is reliance on Java and Graphviz – I bypassed this requirement by selecting use of the cloud-based rendering engine – this however is not suitable for the confidentiality requirements of a corporate environment. You’ll want a local server for that situation.
Setting up PlantUML in Visual Studio Code
In Visual Studio Code, go into ‘Extensions’ and install the PlantUML extension. To avoid installing Java and GraphViz it is possible to set it to render in the cloud (WARNING: Don’t do this if you’re working on confidential diagrams):
In the PlantUML Extention settings, scroll down to ‘Plantuml: Render’ and change to ‘PlantUMLServer’
An alternative is to install a local PlantUML server (available as a container).
Working with PlantUML in Visual Studio Code
In Visual Studio Code, save PlantUML code as *.wsd (Diagram) format and then ALT+D launches the diagram preview pane. Export diagram by right-clicking code and selecting appropriate option.
Getting the Best out of PlantUML
I find PlantUML works best if you start first with a diagram type that you want to create, as the language syntax and visual layout differ significantly between types. The diagram type is auto-detected (based on some arcane rules), so you’re best to start with example code for the diagram type you want, and then mangle the diagram code to suit what you want. This requires some up-front thinking about who the audience will be, the types of diagram they are familiar with, and what diagram type best suits their needs.
PlantUML Examples
All diagrams in this post are generated from PlantUML[5] code (click on diagram captions to see source code); here are some made-up examples of useful diagram types:
Sequence Diagram
Sequence diagrams are useful for understanding events between participants over time, as per example in Figure 5.

Figure 5 – Example Sequence Diagram
Use Case Diagram
Use case diagrams show how users interact with systems, as per example in Figure 6.
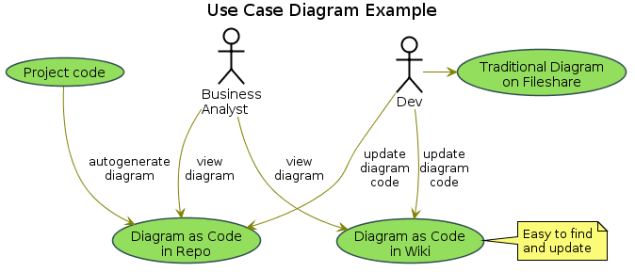
Figure 6 – Example Use Case Diagram
Class Diagram
Class diagrams are used in software engineering to model software classes, showing their name/attributes/methods and how they relate to one another, as per example in Figure 7.

Figure 7 – Class Diagram Example
Activity Diagram
Activity diagrams are used to show a workflow from start to completion through any number of steps including actions and decisions. This type of diagram is useful for representing processes, and an example is shown in Figure 8.

Figure 8 – Activity Diagram Example – A Process for Using PlantUML
Component Diagram
Component diagrams are used to visualise the components that make up a system, and how they interconnect, as opposed to how the system behaves. An example is shown in Figure 9.
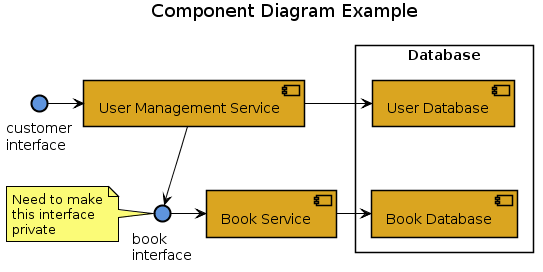
Figure 9 – Component Diagram Example
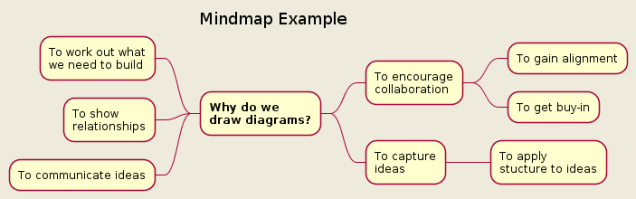
Mindmap
Mindmaps are useful for getting thoughts down quickly, as per Figure 10.
Other Diagram Types
PlantUML supports other diagram types too, including network diagrams (http://plantuml.com/nwdiag), work breakdown structures, Gantt charts etc. Check out the language spec (http://plantuml.com/guide) for more info.
Potential Objections
PlantUML is not perfect. I found myself spending time fighting the layout – lines that cross text can be a problem (see Figure 11), until you figure out the layout techniques. Looking for ways to change the appearance of items can also be challenging, and the legend capability is very limited.
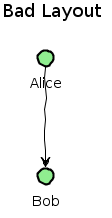
Figure 11 – Putting the Arrow through Alice is not cool…
It can take longer to draw a diagram in PlantUML than on a whiteboard or in a GUI app, and the in-app help when the language doesn’t compile is almost non-existent.
The PlantUML DSL is not standards-based, and sometimes inconsistent (i.e. –> is a dashed line in a sequence diagram, but a solid line in a component). That brings me to another bug bear – why on earth is the diagram type not explicit in the code? The implicit auto-detect of the diagram type just seems wrong to me.
Alternatives to PlantUML
There are of course alternatives to PlantUML; a few notable ones are Mermaid (https://mermaidjs.github.io/#/) and yUML (https://yuml.me/), however I have not as yet looked into them.
Where to go for More Info
I have started an under construction GitHub Repo of example diagrams at https://github.com/mattjhayes/PlantUML-Examples with PlantUML code for reference to help me learn the language. Feel free to contribute if you have ideas or corrections.
A good site of example PlantUML diagrams is https://real-world-plantuml.com/
Wrapping it up
I found PlantUML to be a useful addition to my solution architect kit bag of tools. I won’t use it all the time (it won’t fully replace whiteboard and Visio for me) – I see it as having a use in software engineering, and where collaboration on diagrams is required in a wiki or source code repo setting.
Time permitting, I will check out some PlantUML alternatives too, and may even blog them.
So, is a picture [diagram] really worth a thousand words? I can’t answer that question, but I can say PlantUML is a really efficient way to create diagrams from few words – diagrams in this post were generated from PlantUML code with average 89 words. That really is thrifty!
On a five star scale[6], I give PlantUML three and a half stars for being free and useful, and four stars for diagrams-as-code for being a great concept that improves documentation quality, while also reducing human diagram drudgery.
References
[1] See chapter 25 of ‘Incredible Journeys‘ by David Barrie (ISBN 978 1 47365 683 3) for more on the neuroscience behind human navigation
[2] Whiteboards can be useful for collaboration (and as a place for people to put up ideas on post-it notes)
[3] See: https://www.martinfowler.com/bliki/UmlAsSketch.html
[4] For PlantUML language reference, see: http://plantuml.com/guide
[5] Diagrams in this post were generated with PlantUML version 1.2019.08
[6] Use of 5-star scale inspired by John Green’s podcast ‘The Anthropocene Reviewed‘ (https://www.wnycstudios.org/podcasts/anthropocene-reviewed). It’s really good – you should check it out.

Sounds very interesting Matt, looking forward to seeing some of your future diagrams-as-code
LikeLike